🏠 Atari Jaguar Developer Reference ▸ Tom — Graphics & Video ▸ CRY Color & Color Mapping
CRY Color & Color Mapping
How the Jaguar represents color: true-color modes, the 16-bit RGB scheme, and the CRY (Cyan-Red-Intensity) scheme that gives cheap Gouraud shading from 16-bit pixels.
Source: Software Reference Manual — Tom & Jerry (V10), pp. 30–33. © Atari Corp. 1995.
Introduction
The Jaguar produces video output using eight digital bits each for red, green and blue. This gives each output 256 intensity levels, enough for smooth shading from one color to another. This 24-bit scheme is known as true-color.
True-color mode (24-bit)
The Jaguar can display true-color pixels stored in memory as long words, with 8 bits unused — i.e. 32-bit pixels. This is true-color mode. The drawbacks:
- These 32-bit pixels are large and consume a lot of memory.
- They consume a lot of memory bandwidth to fetch from RAM for display.
True-color mode is therefore unattractive for general use — most images do not need its color range, and it has detrimental effects on performance. It is treated as a special case: when it is used, only true-color images may be displayed.
Normal operation (16-bit)
In normal operation the display system is based on sixteen-bit pixels. Images in memory may be stored either as 16-bit pixels, or as 1, 2, 4 or 8-bit logical colors. Logical colors are used as indices into a Palette / Color-Look-Up-Table (CLUT), which holds their corresponding 16-bit physical colors.
A 16-bit pixel may be stored as RGB 5:6:5 (six bits of green, five bits each of red and blue) — but this no longer allows smooth shading. The alternative is the CRY scheme (Cyan, Red and Intensity), which still allows smooth intensity shading.
| Mode | Pixel size | Layout | Smooth shading |
|---|---|---|---|
| True-color | 32-bit (8 unused) | 8 R : 8 G : 8 B | Yes |
| 16-bit RGB | 16-bit | 5 R : 6 G : 5 B | No |
| 16-bit CRY | 16-bit | see below | Yes (intensity) |
| Logical (CLUT) | 1 / 2 / 4 / 8-bit | index into CLUT → 16-bit physical color | depends on CLUT contents |
The CRY Color Scheme
Gouraud Shading Requirements
CRY was derived principally to meet the requirements of Gouraud shading — a technique that models the appearance of a lit curved surface from a set of polygons. If the intensity from a light source is calculated per polygon and the whole polygon painted in that color, the individual polygons making up the surface are clearly visible.
Gouraud shading avoids this by calculating the intensity at each vertex, then linearly interpolating along each polygon edge and hence along each scan line of the display. If only white light sources are concerned, the only variation is luminous intensity, not color. It is therefore attractive to have a color scheme containing an intensity vector, so the Gouraud calculation need only be performed for one value rather than the three values a true-color scheme would require.
There is general agreement that eight bits is enough to give smooth intensity shading (and it is a round number), so a scheme was needed that expressed the color in the remaining eight bits.
Color Space
The color space is modelled as an RGB cube:
- The lowest vertex represents black; the highest represents white.
- The three edges running out from black are the three orthogonal vectors red, green and blue. Their sum can describe any point in the cube.
- The three lower vertices represent fully saturated red, green and blue; the three higher ones represent yellow, cyan and magenta.
This model is only one of many ways of considering what the human brain “sees”, but it has the advantage of modeling the display system used by color monitors and of being mathematically simple.
Physical Requirements
The intensity vector is the component of the sum of the red, green and blue vectors that lies along the diagonal of the RGB cube from black to white. This is not the “true” intensity (a weighted sum of R, G and B), but it bears a linear relationship to it when the color is not changed.
The color value must be encoded in the remaining eight bits of the pixel, subject to these requirements:
- All 256 values should represent valid, and different, colors.
- The colors should be well spaced out across the color space.
- Colors should be able to be mixed by linearly averaging their color values.
- An intensity value of zero must be black.
Because the color space without intensity is two-dimensional, two vectors are required to represent a point in it. An r, θ (polar) scheme was discarded because it would not meet requirement 2, so a scheme based on two x, y vectors was chosen.
To meet requirement 1 the two vectors must describe a point on a square area. As no existing color space model is square when viewed along the intensity axis, a new one was needed. The approach chosen, after considerable experimentation, was to take the view along the intensity axis of the RGB cube — a hexagon — and distort it into a square. This does not quite meet requirement 3, but is close to it.
CRY Color Scheme
The chosen scheme defines 256 points on the upper surface of the RGB cube.
The hexagon (the view looking down onto the RGB cube) is distorted into a square whose X and Y coordinates are four-bit values, defining 256 color levels. Green was chosen as the primary color lying in the middle of one face — selected after observing the three possible mappings, and matching the expected result because the human eye is least able to distinguish shades of green.
In each of the three areas defined on the hexagon/square, one of red, green or blue is at full intensity and the others vary. At the center (white) all three are at full intensity. The intensity scale for any given color lies along the line between black and the point on the top surface of the cube defined in the color table.
Colors may be averaged by taking the average of their eight-bit intensity value and of each of the four-bit X and Y color components. This will not produce exactly the same color as the midway point between them in the RGB cube, but will be close to it.
16-bit CRY pixel bit allocation
| Field | Bits | Width | Description |
|---|---|---|---|
| Intensity | 15–8 | 8 | Luminous intensity (intensity 0 = black) |
| Color X (Cyan) | 7–4 | 4 | X coordinate of the distorted-hexagon square |
| Color Y (Red) | 3–0 | 4 | Y coordinate of the distorted-hexagon square |
Note: the manual specifies an 8-bit intensity value plus two 4-bit X/Y color components (8 + 4 + 4 = 16 bits). The exact bit ordering of the X/Y fields within the low byte is not stated explicitly in this section; the table above reflects the C-R-Y (Cyan / Red / Intensity) naming convention.
Pros and cons
Advantages
- Smooth intensity shading from 16-bit pixels.
- Better matched to the capabilities of the human eye than 5:6:5-bit RGB schemes.
- Suitable for efficient Gouraud shading.
Disadvantages
- Steps are visible in smooth changes of saturation or hue.
- Translation from RGB to CRY is not straightforward.
- Non-standard.
RGB to CRY conversion
The best technique:
- Calculate the intensity value, which is the largest of red, green and blue.
- From this, calculate the ideal ROM entry for that color by scaling the RGB values by
255 / intensity. - Match this to the actual ROM tables to find the nearest match.
A quick way of doing this is by a look-up table. It is not necessary for this to have 2²⁴ entries: taking the top five bits of each of red, green and blue (rounding where appropriate) and using a 32768-element (2¹⁵) look-up table is adequate.
Physical Implementation
The eight-bit color value indexes a look-up table of modifier values for each of Red, Green and Blue. Each modifier is multiplied by the intensity value to give the output drive level for the display (24-bit RGB output).
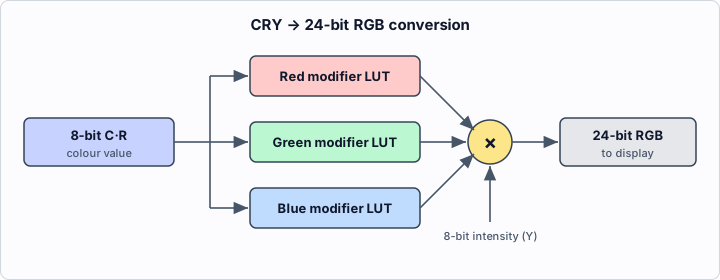
The look-up tables below are each a 16 × 16 grid of modifier values, as printed in the manual. Rows are listed top to bottom as they appear in the source; each row contains 16 entries.
Red look-up table
| Row | Values |
|---|---|
| 1 | 0, 0, 0, 0, 0, 0, 0, 0, 0, 0, 0, 0, 0, 0, 0, 0 |
| 2 | 34, 34, 34, 34, 34, 34, 34, 34, 34, 34, 34, 34, 34, 34, 19, 0 |
| 3 | 68, 68, 68, 68, 68, 68, 68, 68, 68, 68, 68, 68, 64, 43, 21, 0 |
| 4 | 102, 102, 102, 102, 102, 102, 102, 102, 102, 102, 102, 95, 71, 47, 23, 0 |
| 5 | 135, 135, 135, 135, 135, 135, 135, 135, 135, 135, 130, 104, 78, 52, 26, 0 |
| 6 | 169, 169, 169, 169, 169, 169, 169, 169, 169, 170, 141, 113, 85, 56, 28, 0 |
| 7 | 203, 203, 203, 203, 203, 203, 203, 203, 203, 183, 153, 122, 91, 61, 30, 0 |
| 8 | 237, 237, 237, 237, 237, 237, 237, 237, 230, 197, 164, 131, 98, 65, 32, 0 |
| 9 | 255, 255, 255, 255, 255, 255, 255, 255, 247, 214, 181, 148, 115, 82, 49, 17 |
| 10 | 255, 255, 255, 255, 255, 255, 255, 255, 255, 235, 204, 173, 143, 112, 81, 51 |
| 11 | 255, 255, 255, 255, 255, 255, 255, 255, 255, 255, 227, 198, 170, 141, 113, 85 |
| 12 | 255, 255, 255, 255, 255, 255, 255, 255, 255, 255, 249, 223, 197, 171, 145, 119 |
| 13 | 255, 255, 255, 255, 255, 255, 255, 255, 255, 255, 255, 248, 224, 200, 177, 153 |
| 14 | 255, 255, 255, 255, 255, 255, 255, 255, 255, 255, 255, 255, 252, 230, 208, 187 |
| 15 | 255, 255, 255, 255, 255, 255, 255, 255, 255, 255, 255, 255, 255, 255, 240, 221 |
| 16 | 255, 255, 255, 255, 255, 255, 255, 255, 255, 255, 255, 255, 255, 255, 255, 255 |
Green look-up table
| Row | Values |
|---|---|
| 1 | 0, 17, 34, 51, 68, 85, 102, 119, 136, 153, 170, 187, 204, 221, 238, 255 |
| 2 | 0, 19, 38, 57, 77, 96, 115, 134, 154, 173, 192, 211, 231, 255, 255, 255 |
| 3 | 0, 21, 43, 64, 86, 107, 129, 150, 172, 193, 215, 236, 255, 255, 255, 255 |
| 4 | 0, 23, 47, 71, 95, 119, 142, 166, 190, 214, 238, 255, 255, 255, 255, 255 |
| 5 | 0, 26, 52, 78, 104, 130, 156, 182, 208, 234, 255, 255, 255, 255, 255, 255 |
| 6 | 0, 28, 56, 85, 113, 141, 170, 198, 226, 255, 255, 255, 255, 255, 255, 255 |
| 7 | 0, 30, 61, 91, 122, 153, 183, 214, 244, 255, 255, 255, 255, 255, 255, 255 |
| 8 | 0, 32, 65, 98, 131, 164, 197, 230, 255, 255, 255, 255, 255, 255, 255, 255 |
| 9 | 0, 32, 65, 98, 131, 164, 197, 230, 255, 255, 255, 255, 255, 255, 255, 255 |
| 10 | 0, 30, 61, 91, 122, 153, 183, 214, 244, 255, 255, 255, 255, 255, 255, 255 |
| 11 | 0, 28, 56, 85, 113, 141, 170, 198, 226, 255, 255, 255, 255, 255, 255, 255 |
| 12 | 0, 26, 52, 78, 104, 130, 156, 182, 208, 234, 255, 255, 255, 255, 255, 255 |
| 13 | 0, 23, 47, 71, 95, 119, 142, 166, 190, 214, 238, 255, 255, 255, 255, 255 |
| 14 | 0, 21, 43, 64, 86, 107, 129, 150, 172, 193, 215, 236, 255, 255, 255, 255 |
| 15 | 0, 19, 38, 57, 77, 96, 115, 134, 154, 173, 192, 211, 231, 255, 255, 255 |
| 16 | 0, 17, 34, 51, 68, 85, 102, 119, 136, 153, 170, 187, 204, 221, 238, 255 |
Blue look-up table
| Row | Values |
|---|---|
| 1 | 255, 255, 255, 255, 255, 255, 255, 255, 255, 255, 255, 255, 255, 255, 255, 255 |
| 2 | 255, 255, 255, 255, 255, 255, 255, 255, 255, 255, 255, 255, 255, 255, 240, 221 |
| 3 | 255, 255, 255, 255, 255, 255, 255, 255, 255, 255, 255, 255, 252, 230, 208, 187 |
| 4 | 255, 255, 255, 255, 255, 255, 255, 255, 255, 255, 255, 248, 224, 200, 177, 153 |
| 5 | 255, 255, 255, 255, 255, 255, 255, 255, 255, 255, 249, 223, 197, 171, 145, 119 |
| 6 | 255, 255, 255, 255, 255, 255, 255, 255, 255, 255, 227, 198, 170, 141, 113, 85 |
| 7 | 255, 255, 255, 255, 255, 255, 255, 235, 204, 173, 143, 112, 81, 51 … |
| 8 | 255, 255, 255, 255, 255, 255, 247, 214, 181, 148, 115, 82, 49, 17 |
| 9 | 237, 237, 237, 237, 237, 237, 237, 237, 230, 197, 164, 131, 98, 65, 32, 0 |
| 10 | 203, 203, 203, 203, 203, 203, 203, 203, 203, 183, 153, 122, 91, 61, 30, 0 |
| 11 | 169, 169, 169, 169, 169, 169, 169, 169, 169, 170, 141, 113, 85, 56, 28, 0 |
| 12 | 135, 135, 135, 135, 135, 135, 135, 135, 135, 135, 130, 104, 78, 52, 26, 0 |
| 13 | 102, 102, 102, 102, 102, 102, 102, 102, 102, 102, 102, 95, 71, 47, 23, 0 |
| 14 | 68, 68, 68, 68, 68, 68, 68, 68, 68, 68, 68, 68, 64, 43, 21, 0 |
| 15 | 34, 34, 34, 34, 34, 34, 34, 34, 34, 34, 34, 34, 34, 34, 19, 0 |
| 16 | 0, 0, 0, 0, 0, 0, 0, 0, 0, 0, 0, 0, 0, 0, 0, 0 |
Note on the source layout: In the original manual these tables are printed as columns of values with inconsistent grouping (some entries run together on a line, e.g. “102 102 102”), so the exact 16-per-row boundaries for a few rows are reconstructed from the regular structure of the surrounding rows. The Blue table rows 7 and 8 are printed in the source with fewer than 16 explicit entries before a line break, so their full 16-value extent at the start of each row is (illegible) in the source as transcribed; the trailing values shown are faithful to the text.
See also
- Object Processor
- Blitter (Gouraud shading)
- Memory Map / Register List (CLUT)
- System Architecture Overview
◀ Prev: Blitter (Tom) · 🏠 Home · Next: Digital Sound Processor (DSP) ▶
Jump to: Architecture · Memory Map · Registers · Instructions · Glossary · CD-ROM